Duplicates in sys.query_store_wait_stats
For machine learning, or in general any data analysis task, we need data. That’s not enough because data has to be in the right shape and data wrangling is usually tedious/time consuming/character shaping experience. QueryStore is one of the most important tools in context of Performance Intelligence (synonym for gaining performance insights and making automated decisions) because it provides consistent and unified view on queries’ performance by forming multi-feature timeseries for every query-plan-interval:
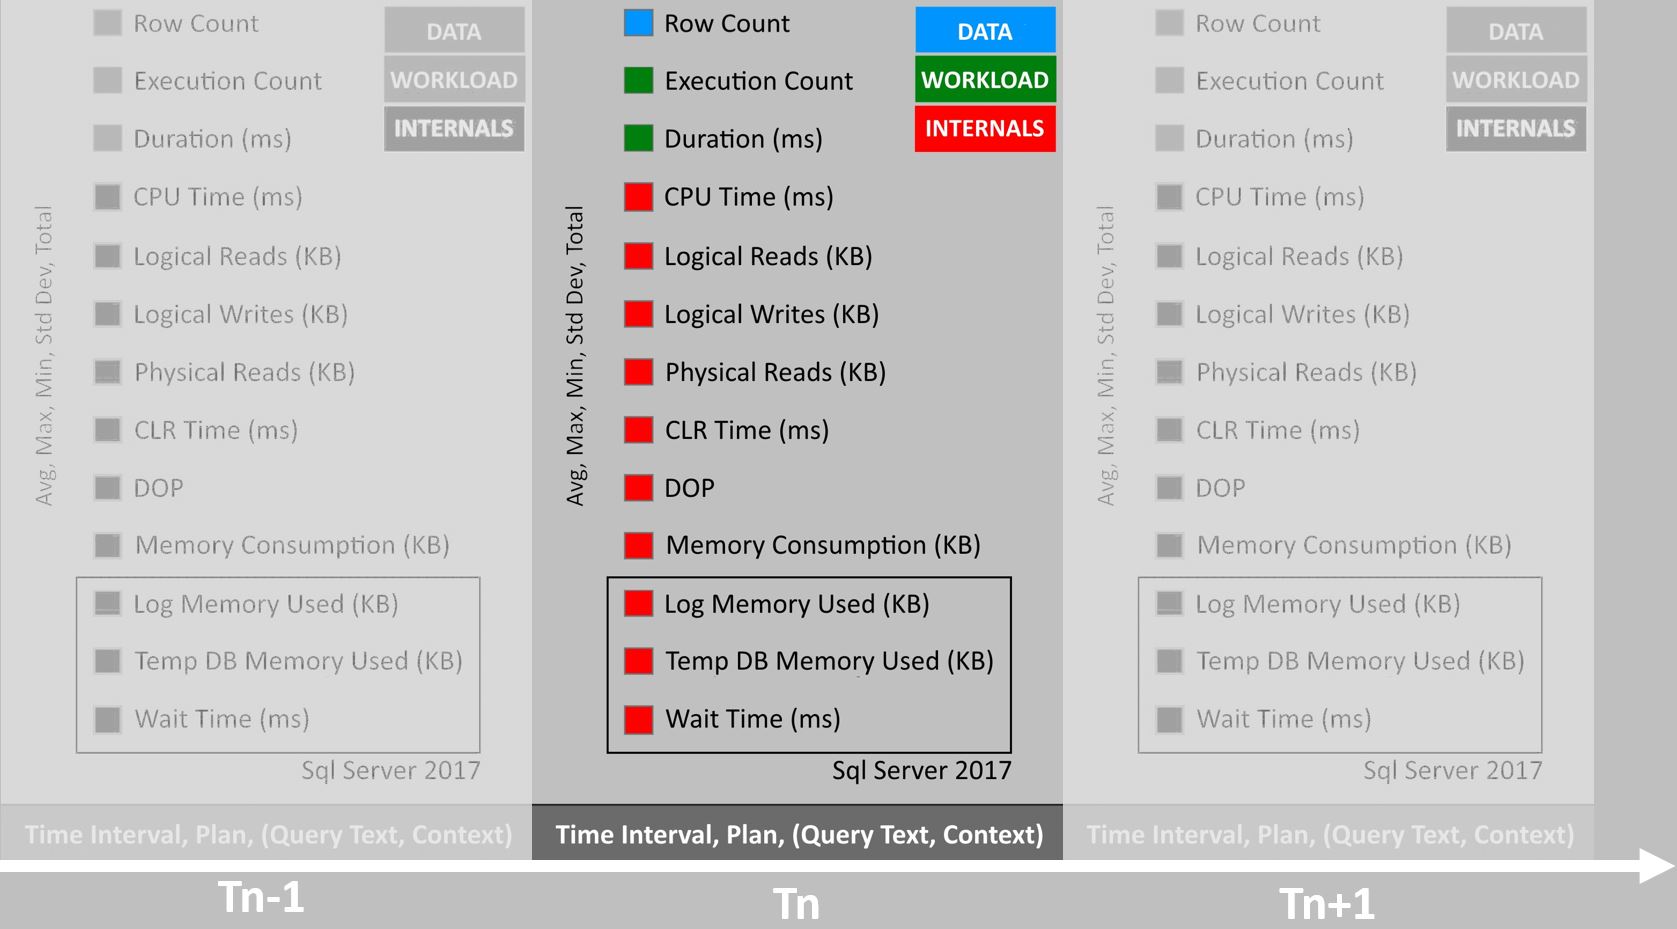
What’s more it’s real-time and it doesn’t require any post-processing (except steps described below). There are some restrictions to take into account (for continuity objects shouldn’t be dropped/recreated and database renamed) but that’s subject for another post. I’ve disused and gave presentations about tools built on top of QueryStore like Performance Recommendations and Automatic Tuning, but I haven’t properly covered recent changes in QueryStore that made that shift possible. These include:
- Temp DB Memory Used (KB)
- Log Memory Used (KB) - as above, but relevant in Azure Sql Database
- Wait Stats
sys.query_store_wait_stats
In Sql Server 2016 version of QueryStore there is plan store and runtime statistics store. Sql Server 2017 introduces 3rd structure - Wait Stats store. Wait Stats are captured at query plan level and are available through sys.query_store_wait_stats. It’s special view because from all objects in sys.querystore* only that one has to be aggregated before data can be consumed. Without GROUP BY it can return duplicates and combination of (plan_id, runtime_stats_interval_id, execution_type, wait_category) is not unique. In means that for the same plan/query that view can return maximum two rows (one represents in-memory and another on-disk stats) for particular wait_category and interval and that might be confusing. Steps to reproduce issue:
- Enable QS and set INTERVAL_LENGTH_MINUTES to something long like default 60 (1h)
- Run resource consuming query
- Flush stats captured in QueryStore to disk
- Rerun query from p.2
- Examine output of sys.query_store_wait_stats
Result set with duplicates:
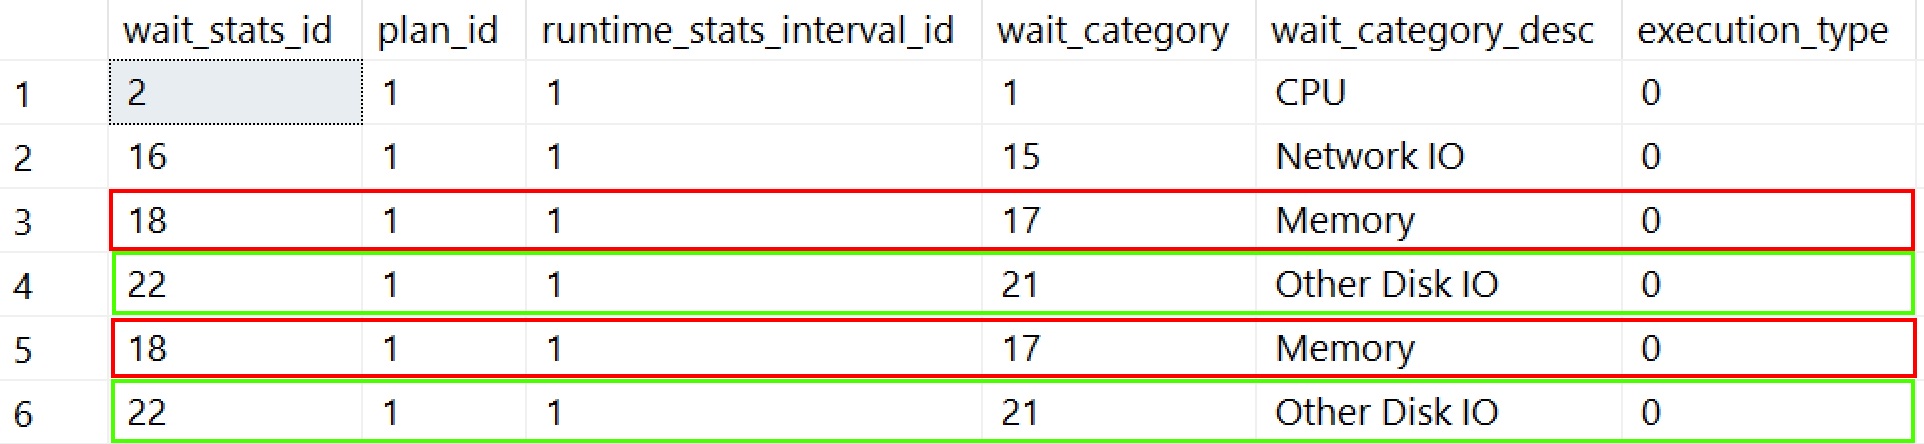
In the example above I used WideWorldImporters database and query that causes TempDB spills (order by unindexed column with forced serialised execution). That can also be tracked using new ‘Temp DB Memory Used (KB)’ metric or ‘Other Disk IO’ (that contains IO_COMPLETION). There’s more than one way to skin a cat. Finally my recommended way of getting data from sys.query_store_wait_stats:
Wait categories
Also below are waits categories mapped to types of waits (based on BOL). Might be useful for demos/presentations.